
A Step-by-Step Guide to Making Art with Observable
- Karl Sluis
- Mar 28, 2020
- 5 min read
Updated: Apr 4, 2020
How to use online, interactive notebooks to make plotter art
Observable is a web application I've used to make plotter art. I've experimented with several tools and languages to make art (Python, JavaScript, Processing, Rhinoceros, Illustrator, and others) and while each tool has unique abilities, Observable offers a special combination of easy collaboration, interactive widgets, and fast performance that makes it a really handy tool to make SVG art, like this plot I made last year:

Let's use an Observable notebook to recreate this below, unattributed-but-likely-Bauhaus-based drawing—and we'll make it interactive, too, so that you can add your own twist. It will be helpful to have a basic understanding of JavaScript. We'll use a little D3 but don't worry, I'll explain as we go. Onward!

Step 1: Create an Observable Notebook
Fire up your browser, head over to www.observablehq.com, create an account and then create a new notebook. You'll see something like this:

Ah, a blank canvas, save for this untitled entry. We can skip an explanation of Markdown language; let's just take advantage of the pre-selected text and give our notebook a name.
Next, we're going to make D3 available within our Observable notebook. Click on the little plus sign along the left-hand rail of the notebook to create a new cell, then copy and paste in the code below:
d3 = require("d3@5")Check this out:

In Observable, any time you want to "run" a cell, hit shift-enter. Smash those two keys at the same time and you'll see that d3 is now available as a variable for any other cell in your notebook. Congratulations: you're already adding cells and executing code!

One more thing to do: we're going to create an SVG element in our notebook so that we can start drawing some circles. After some tinkering and exploring, I put together some boilerplate JavaScript to add to all my notebooks to get started: no need to reinvent the wheel here, just copy, paste, and shift-enter!
svg = {
    let height = width/2;
    const svg = DOM.svg(width,height);
    return svg;
}
Look at that. First, you created a variable "height" and set it to half the value of the width of your notebook. Then, you created a variable called "svg" that selects the DOM, adds an SVG element, and sets the width of the SVG to "width" and the height of the SVG to "width/2." Finally, we "return" the value of the variable "svg" and Observable does the work of adding the SVG to the notebook.
You can edit and fork any public notebooks on Observable. If you want to follow along, check out this notebook. Onward!
Step 2: Let's Draw a Circle
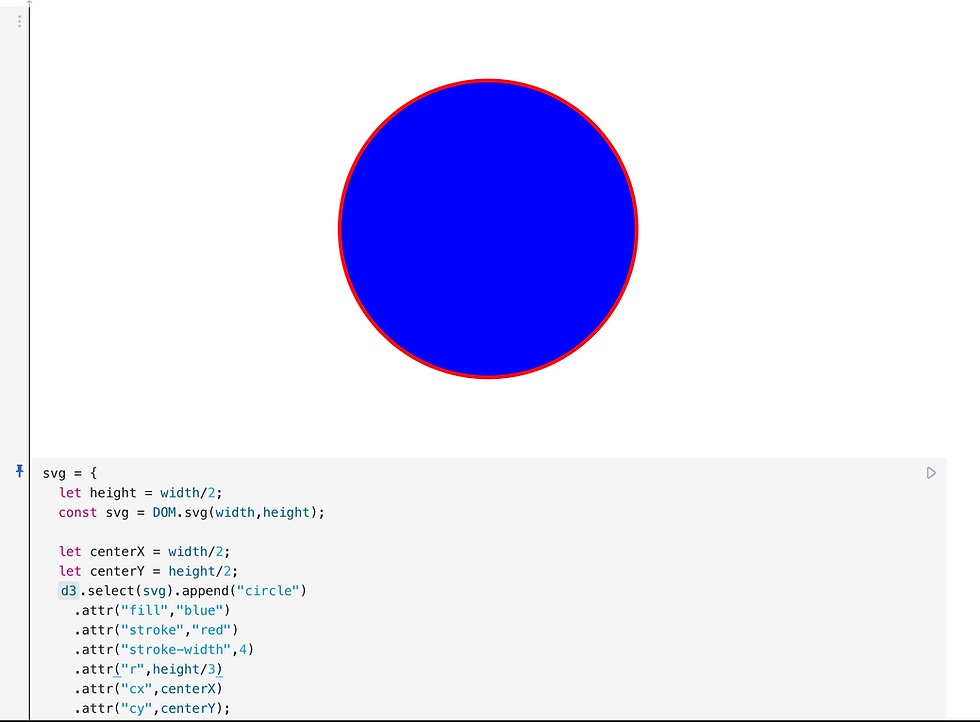
Here comes the fun part. We'll start simple and draw a circle in the middle of our sketch. Add this code to your notebook:
let centerX = width/2;
let centerY = height/2;
d3.select(svg).append("circle")
    .attr("fill","none")
    .attr("stroke","black")
    .attr("stroke-width",1)
    .attr("r",height/2)
    .attr("cx",centerX)
    .attr("cy",centerY);
First, we're calculating the center point for the width ("centerX") and the height ("centerY") of your notebook. Next, we're using D3 (finally!) to select the "svg" variable and append an SVG circle element. While we could use plain-old JavaScript to select and modify our SVG element, D3 makes it a little easier. Then, we add some attributes to our circle: colors, radius, and a center point:

Not bad! And check this out: you can inspect your notebook with your browser's developer tools. This is really helpful for debugging.

Here's a link to our second notebook: take a moment, open it up, and play around with the values of some of the attributes—just don't forget to hit shift-enter to see the results of any changes that you've made. Observable makes it fast and easy to experiment.
Step 3: Let's Draw 100 Circles
Let's supercharge this sketch by adding 99 more circles by incorporating a loop. Check this notebook for reference on this third step. Here's our new code:
let height = 600;
const svg = DOM.svg(width,height);

let centerX = width/2;
let centerY = height/2;
let circleCount = 100;
let radius = 100;

let circleArray = [];
for (let i = 0; i < circleCount; i++) {
    circleArray[i] = i;
}

d3.select(svg).selectAll("circle")
    .data(circleArray)
    .enter()
    .append("circle")
    .attr("fill","none")
    .attr("stroke","black")
    .attr("stroke-width",1)
    .attr("r",radius)
    .attr("cx",centerX)
    .attr("cy",d => radius+d*4);
We're changing quite a few things:
"height" is now set to 600.
We've added two new variables, "circleCount" and "radius."
We've introduced a classic JavaScript for loop to create an array of values.
We've introduced a classic D3 data join to use D3's mystical powers to use data (our array of values) to make our drawing.
Last, we're using an anonymous arrow function to access the values in our array to drive the vertical placement of our circles.
It might seem like overkill now, but trust me, this work will make the next step a little easier to understand. Here's the result:

One hundred circles, all in a row. Next, let's get wavy.
Step 4: Get Wavy
Our straight line of circles is fine, but remember, we're trying to recreate the design from the beginning of this post. It's time for some trigonometry!
Let's see if we can figure this one out. I'm going to write a function to help me convert from angles to radians and I'm also going to change our loop to slice a circle into equal parts, based on the value of our variable "circleCount."
function toRadians(angle) {
    return angle * (Math.PI / 180);
};

let circleArray = [];
for (let i = 0; i <= circleCount; i++) {
    circleArray[i] = (360/circleCount)*i; // 0,3.6,7.2,10.8...
}
I also know from experience that cosine and sine functions are really useful for creating smooth values between -1 and 1 as you iterate over angles.

Good thing we changed our array! Let's set the horizontal position of our circles based on the value a sine function returns from each value in our array "circleArray":
    .attr("cx",d => centerX+Math.sin(toRadians(d))*40)
    .attr("cy",(d,i) => radius+i*4);
Here's the result:

It's cool! But it's not quite what we were trying to create. Let's look again at the original drawing.

It looks like there are two different center points that the circles are rotating around 180 degrees. I bet we can change our code just a bit to make this happen. Check out this notebook to see the changes I made to the "cx" and "cy" attributes.

Step 5: Interaction
We're almost there! I love how Observable makes it really easy to add interaction to your notebooks—so let's add some interaction!
To cap things off, we'll add a slider that will change the number of circles in our drawing. Explore the inputs page to see all of the different inputs that Observable supports for your sketches. First, you'll have to add a slider to your notebook. Add a new cell at the bottom of the notebook with this code:
import {slider} from @jashkenas/inputsThis gives us the ability to add a slider input to our notebook. Next, we have to define our slider in another new cell—it's so clear and easy to understand!
viewof circleCountSlider = slider({
    title: "Number of Circles",
    value: 100,
    min: 4,
    max: 400,
    step: 1
})
Now, just change the variables in the cell that creates your SVG from "circleCount" to "circleCountSlider" and we're there! See the final notebook here


Best of all, Observable has built-in support for exporting SVG, perfect for preparing your work for your next plot.

I hope you enjoyed this brief tutorial on making SVG art with Observable! I enjoyed writing it; the process reminded me of a bunch of other notebooks I've made, including this notebook with inputs for rotating polygons, this notebook that uses D3's GeoJSON support to map the largest rivers in the US, this notebook with inputs for spinning squares, and this notebook that uses D3's Voronoi function.


Please feel free to experiment with my public notebooks, remix them, download some SVGs and make some art—I'd love to see what you make!
About me: I'm Karl Sluis and I'm a maker, a designer, a programmer, an artist. Professionally, I'm a product manager and sometime-developer with an abiding passion for data visualization. Making art keeps me sharp, creative, and sane. Lately, I've been exploring work with brushes and India ink and creating plots that reveal the variables that drive the art. You can find me and my work on Instagram and on Twitter.


pikashow is a helpful entertainment platform with content for different interests. i like how pikashow makes browsing easy and enjoyable. the interface is simple and comfortable to navigate. overall, pikashow continues to be reliable.
Emergency cleanup services demand experience, attention to detail, and a respectful approach in every case. It is encouraging to know dedicated professionals are always ready to respond when needed most. https://360haz.com/ delivers comprehensive biohazard and crime-scene cleanup with skilled technicians available throughout the year. Their consistent quality and compassionate service deserve sincere appreciation.
Every successful painting project begins with careful planning and professional surface preparation techniques. Homeowners benefit when experienced teams prioritize quality over completing work as quickly as possible. https://peacockbuild.com/ consistently demonstrates that thoughtful craftsmanship produces beautiful, long-lasting finishes throughout every project. Their family-run values shine through each completed restoration and repainting job.
The hindi alphabet chart you provided is very helpful for kids and new learners. It visually organizes everything in a simple way, which makes memorization much easier.
Your hindi grammar book pdf section is extremely helpful for students who want to study offline. Having all important topics in a downloadable format makes revision much easier, especially during exams when quick access to notes is very important.